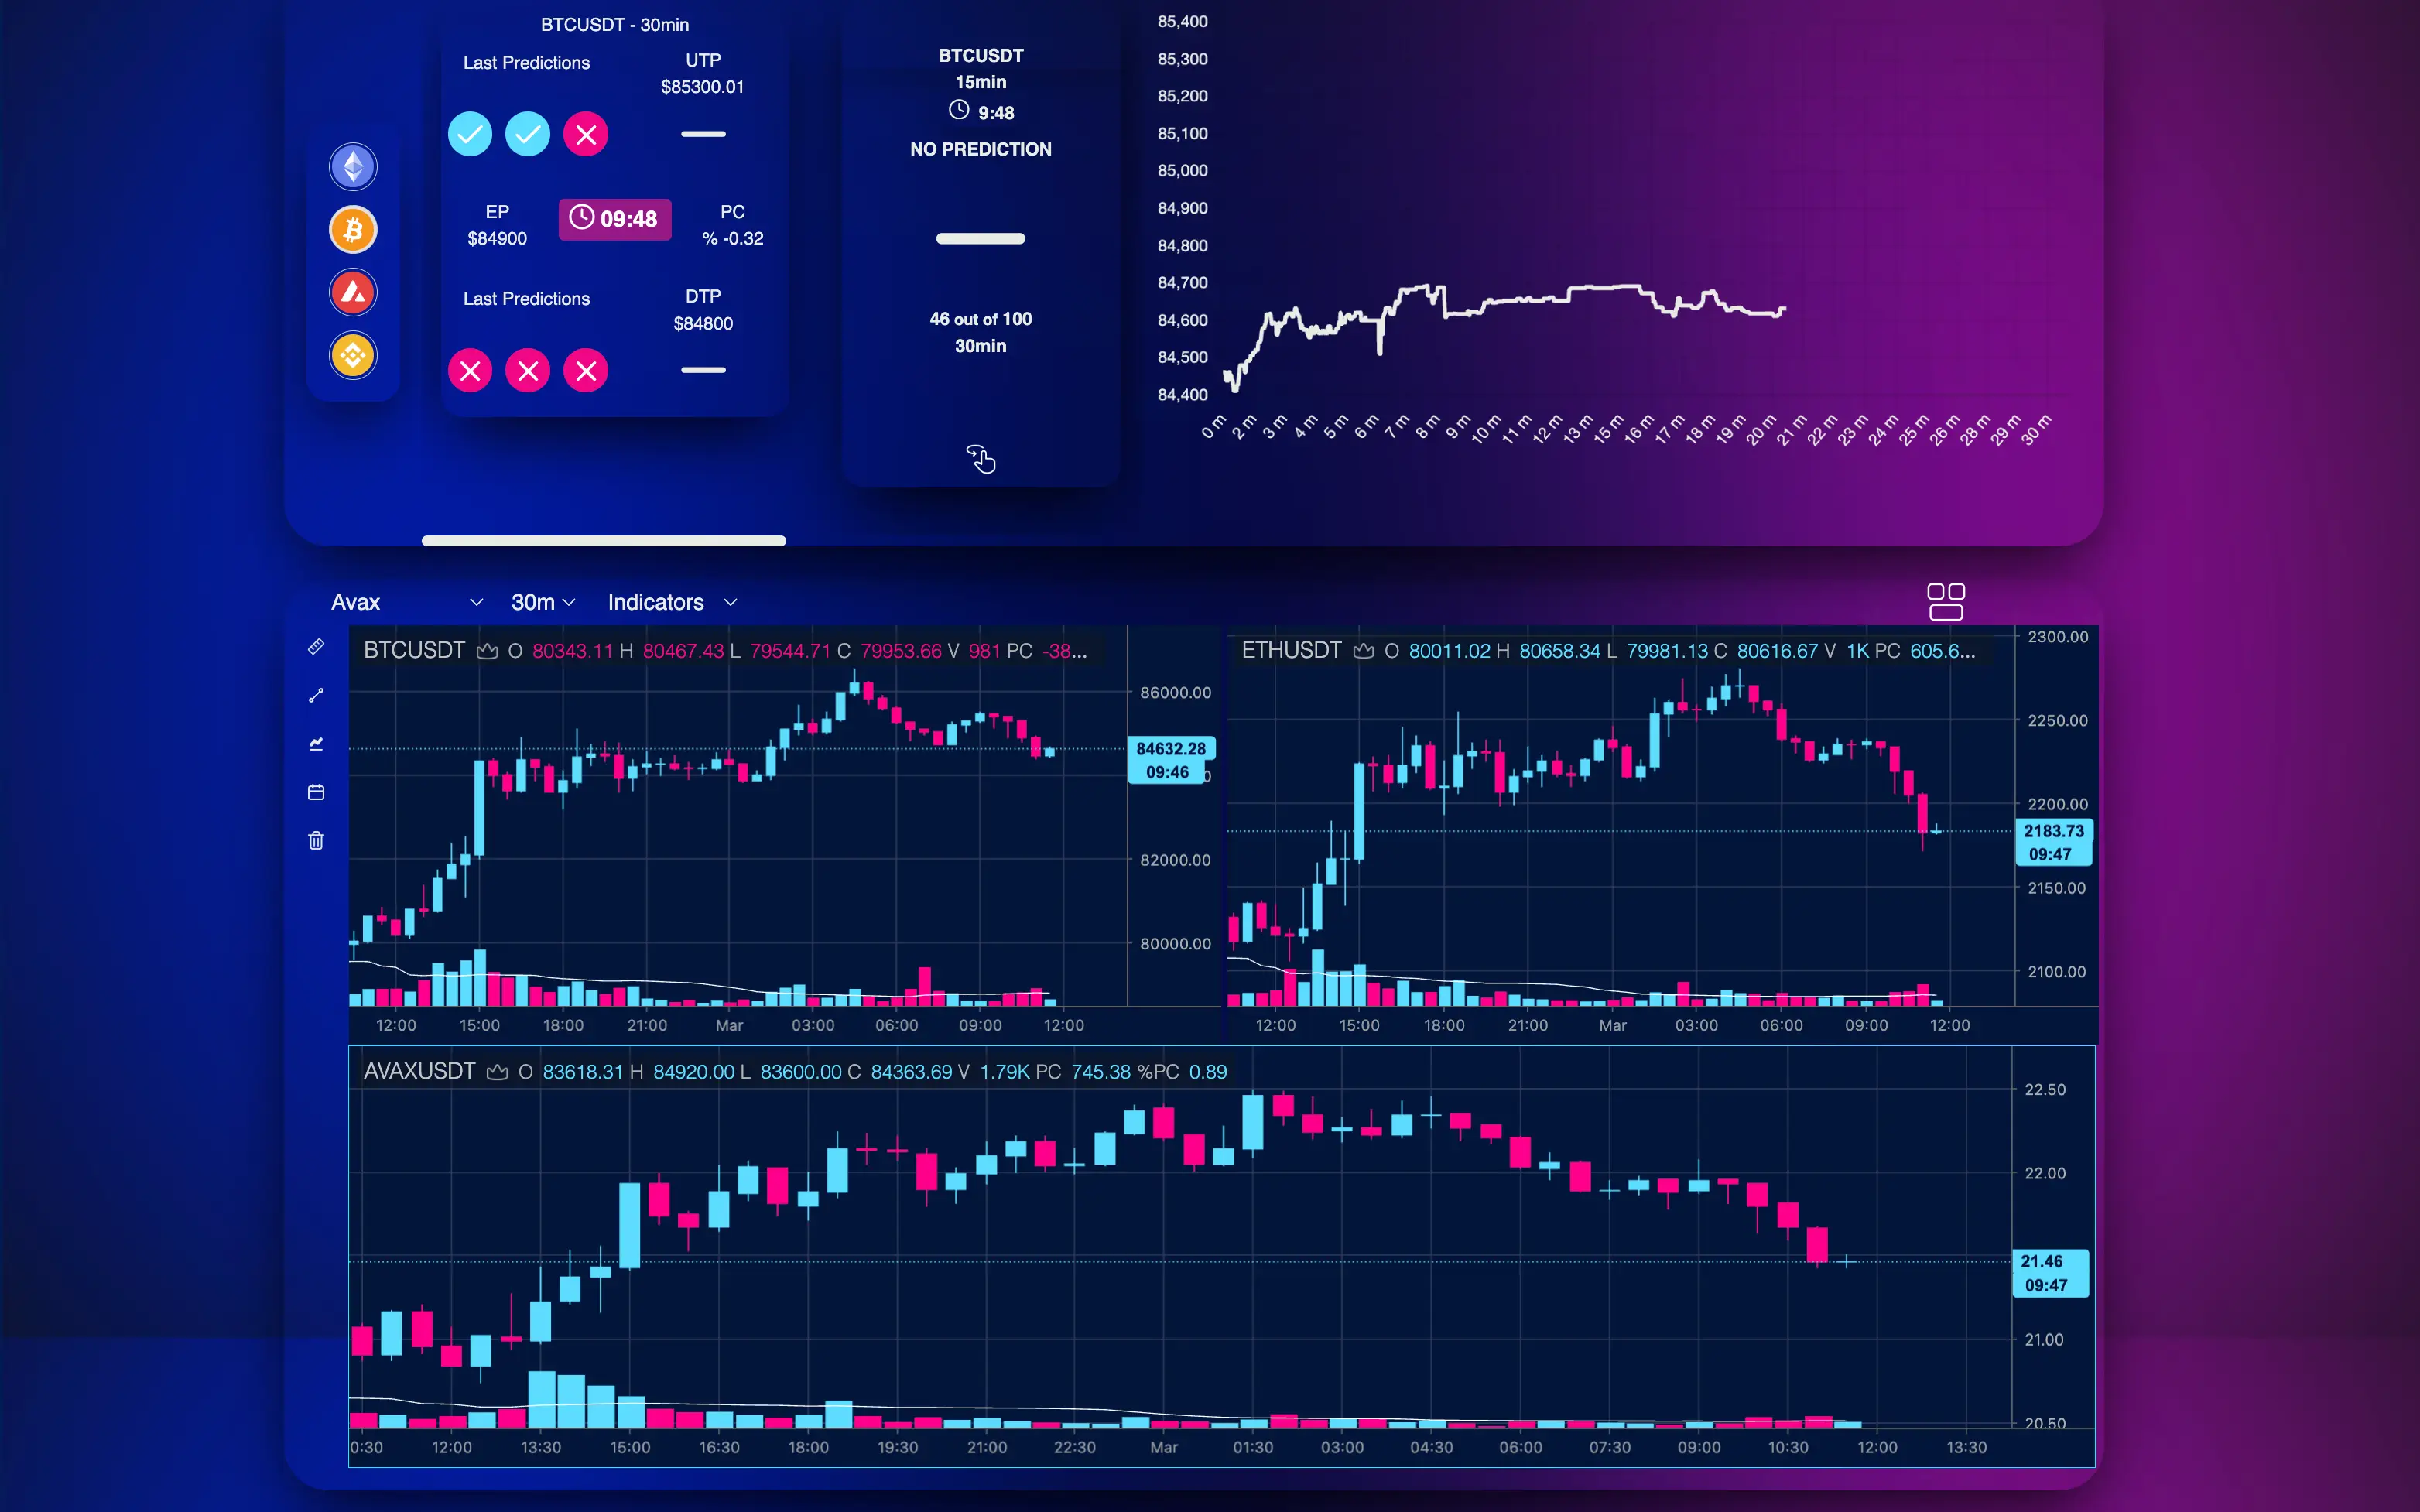
Leading a team of seven developers, I played a key role in both the technical development and project management aspects. The platform was built as a Vue.js Single Page Application (SPA) with a strong focus on user customization and an intuitive interface. As part of the project evolution, I successfully migrated the application from Vue 2 to Vue 3, enhancing performance and implementing new features. The system integrates microservices, APIs, WebSockets, and Redis to ensure efficient data processing, queue management, and caching. A major aspect of my contribution was developing advanced statistical and time-series charts that support both live and static data visualization, allowing users to analyze trends and make informed decisions. By focusing on user experience and functionality, the dashboard provides a seamless way for users to interact with real-time data in a structured and meaningful way.